Case study · Life cycle assessment
When a better LCA
changes the answer
UNROOTED Drinks came to alkatera carrying a footprint they no longer trusted. Rebuilding it moved their flagship product from 0.218 kg CO2e to 0.087 kg. Almost none of that was a real reduction.
The headline
Total combined product emissions
433356
Tonnes CO2e · 18% reduction across the range
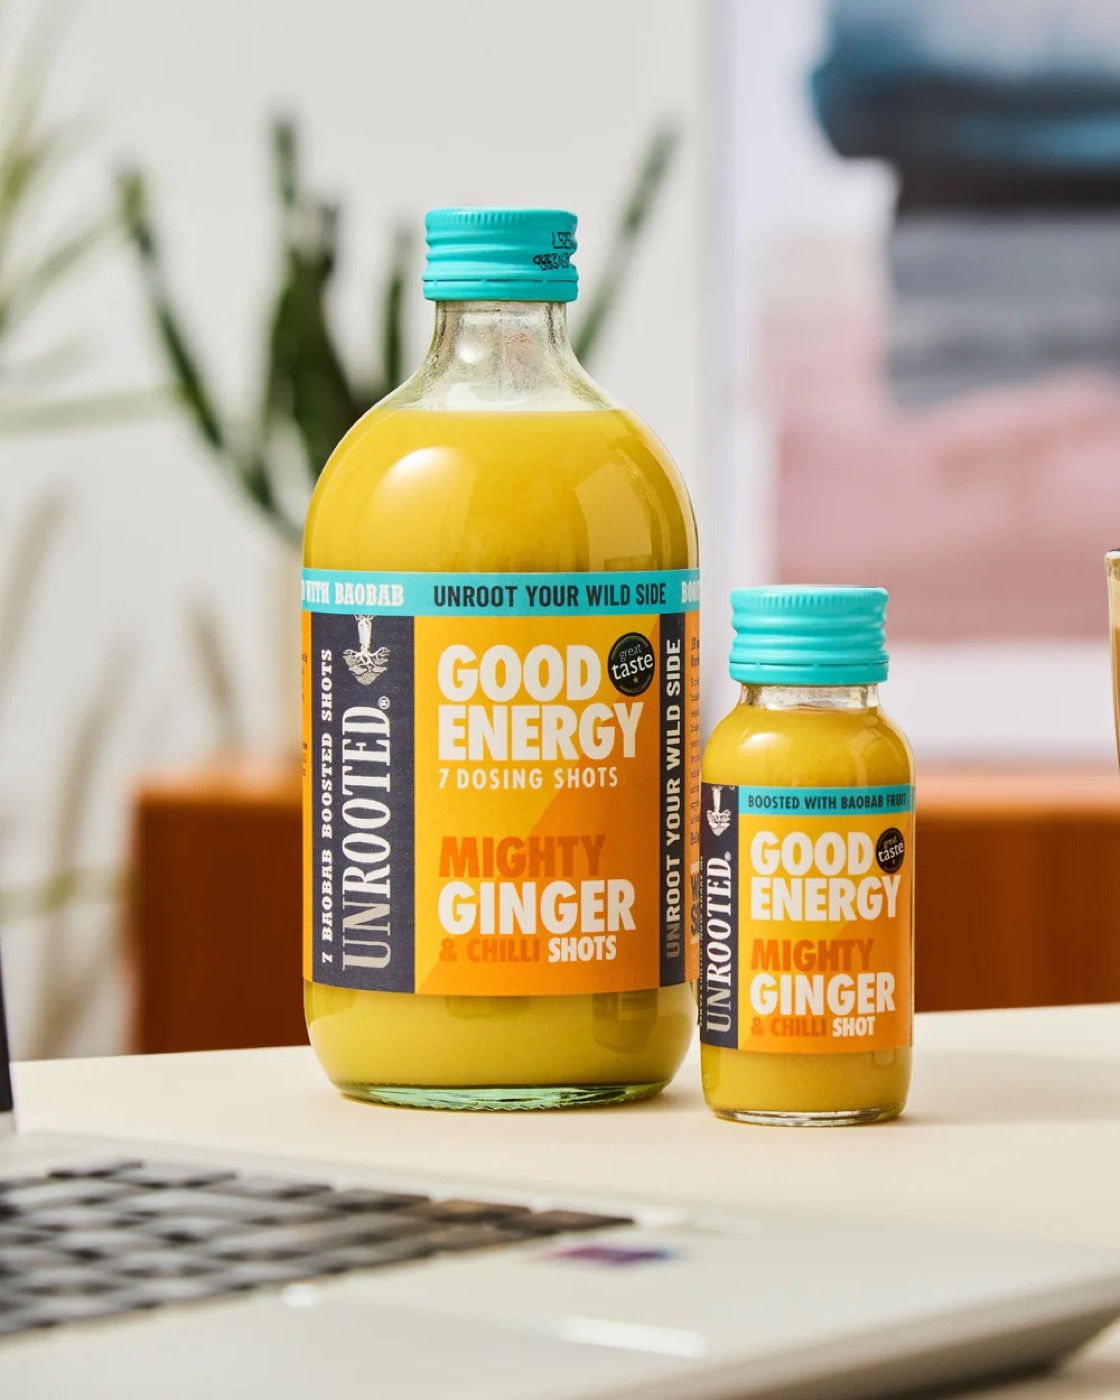
Mighty Ginger 60ml shot
0.2180.087
kg CO2e · 60% drop on the flagship product
UNROOTED Drinks have released their 2025 Impact Report, working with alkatera for the first time. These numbers do not tell the whole story, and UNROOTED said so themselves.
“To be clear: the change, whilst positive, is not due to a reduction in our actual emissions. It is largely down to a change in methodology.”
UNROOTED Drinks · 2025 Impact Report
01 · The brief
Update with more accuracy
Amber Numamoto, UNROOTED’s Head of Operations and Sustainability, came to alkatera in January 2026 looking for a better way to calculate the company’s impact: something she could use in real time, update easily, and not rely on third party inputs she no longer trusted.
UNROOTED had stopped calling themselves carbon neutral in 2024. From 2021 to 2024 they spent over £9,200 on carbon credits, and decided that money was better spent reducing emissions than offsetting them, something we wholeheartedly agree with. Dropping the claim meant the underlying numbers had to carry more weight, because there was no longer a purchased balance sitting on top of them.
They are also a certified B Corp, scoring 85.1 in 2023. Early in 2026 B Lab launched new standards making certification far more rigorous: independent verification replaces self-reporting, and every company must meet minimum standards across all seven impact areas, with no more offsetting a weak area with a strong one. UNROOTED will be submitting to re-certify under the new standards in early 2027.
02 · What was in the old model
Honest work, built on
two borrowed assumptions
UNROOTED completed its first full Life Cycle Assessment in 2022, covering the 2021 data year, and has updated it annually since to reflect the business’s growth. It was competent, ISO 14040 aligned, and honest about its own gaps. It was also, on inspection, carrying an error large enough to over-report on several areas of the company’s emissions.
The assessment measured one product: a single Mighty Ginger 60ml shot, chosen because it was the highest seller. That one model was then applied to the similar products and scaled for the larger formats.
Within that model, material production accounted for 72% of the product’s footprint, and glass bottle production accounted for 75% of material production. In other words, the glass bottle alone was more than half of everything.
The glass figure rested on two assumptions. The first was that producing one 66-gram glass bottle required 6.236 kWh of energy. For scale, that is roughly what a domestic fridge-freezer uses in a week. The second was that 30% of all glass bottles break during manufacturing, and that this loss should be added to every bottle’s footprint. Neither is in line with widely accepted data.
Neither assumption was invented. Both were reached honestly, by people filling gaps in supplier data with the best published material they could find. That is the point.
Elsewhere in the same assessment, the energy required to process baobab powder was estimated by taking Zimbabwe’s national per-capita annual electricity consumption, dividing it by 52 weeks and then by five working days. Lime farming was modelled on lemon farming in Spain. Label ink was calculated from an ink cartridge retailer’s page-yield page. And all of it was reported to four, five, sometimes seven significant figures.
There was one more issue, working in the opposite direction. The old model counted the energy cost of recycling as an emission and gave no credit for the virgin material that recycling avoids. Total end-of-life impact came out as a small positive burden. In a product whose packaging dominates its footprint, that is a meaningful omission.
03 · What we did differently
Eleven SKUs, modelled
one at a time
We helped UNROOTED model eleven SKUs individually rather than extrapolating from a bestseller. Full cradle-to-grave scope, and broader than before: raw material extraction and agricultural production, primary ingredient processing, packaging material manufacture, factory operations and energy, distribution to retail, consumer use phase including refrigeration, and end-of-life disposal with recycling credits properly applied.
The old assessment did include cradle-to-grave, but it added end of life as additional emissions rather than subtracting them.
The difference underneath is not better arithmetic. It is that alkatera never has to go and find an article.
A fixed factor hierarchy
Verified supplier data first, then a curated internal factor library, then Ecoinvent 3.12 or Agribalyse through OpenLCA on the cut-off system model. Only if nothing above exists, a documented category proxy carrying a conservative safety buffer. The model records which tier every number came from, in an immutable audit trail. Nothing gets in without a provenance record, and no factor is ever fuzzy-matched by name.
Recycled content as an input
For each packaging material class we hold a virgin endpoint and a recycled endpoint, then interpolate at the item’s actual recycled content. That is the difference between “a glass bottle” and this glass bottle. It is also why UNROOTED’s move from 0% to more than 30% recycled content shows up as a precise change rather than a guess.
Data quality scored, not assumed
Every input carries a pedigree rating under ISO 14044, covering how reliable, how recent, and how geographically and technologically representative the source is. A number from a supplier’s own energy bills and a number from a national average do not get treated as equally true, and the report says which is which.
Implausibility gets caught. A model that holds real material intensities does not quietly accept six kilowatt-hours to make a 66-gram bottle. That check is most of the job, and it is the one thing a spreadsheet cannot do for you.
The rebuilt assessment conforms to ISO 14044:2006 and ISO 14067:2018. The second of those is the product carbon footprint standard specifically, and it is what an independent verifier will be working from in 2027.
04 · Where the accuracy came from
Source by source
The headline is that Mighty Ginger went from 0.218 kg CO2e to 0.087 kg. The useful part is what changed underneath.
| Component | 2021 model | Rebuilt model |
|---|---|---|
| Glass bottle | Two academic papers giving 6.236 kWh per bottle, plus a 30% manufacturing breakage rate taken from a magazine photography feature | Ecoinvent 3.12 container glass, cut-off, interpolated between virgin and recycled endpoints at the bottle’s actual recycled content |
| Paper label | Ink volume derived from an ink cartridge retailer’s page-yield page | Substrate, coating and adhesive modelled as materials against named datasets |
| End of life | Recycling counted as an energy burden, with no credit for avoided virgin material | Cut-off convention with recycling credits applied, per material |
| Consumer use phase | Not in scope | Refrigeration modelled |
| Baobab processing | Zimbabwe’s national per-capita annual electricity consumption, divided by 52 weeks then by five working days | Supplier data where available, documented proxy where not, pedigree-scored either way |
| Lime | Modelled as lemon farming in Spain | Crop-specific and origin-specific dataset |
| Distribution | All UK and Northern Ireland routes averaged into a single 75-mile journey | Modelled per route |
| Coverage | One SKU, extrapolated across the range | All eleven SKUs modelled individually |
Better datasets, specifics rather than averages, additional phases, and data from across all eleven SKUs rather than extrapolating from one.
05 · The waterfall
How much was real
Of the 0.131 kg the flagship shot appears to have lost, 0.095 kg was measurement error being corrected. Only 0.036 kg was an actual reduction.
kg CO2e per 60ml shot
The 0.218 kg, taken apart
06 · A model changing shape
Where the footprint sits now
These are different bottles, so this is not a like-for-like comparison of components. What it shows is a model changing shape.
Share of total product footprint · bars left of the rule are credits, not burdens
Two rows matter most. End of life moved from a small positive burden to a credit worth −0.0126 kg CO2e, because recycling now displaces virgin material instead of merely costing energy. On a product totalling 0.087 kg, that swing is one of the largest single differences between the two assessments.
And the glass bottle, which was more than half of everything in the old model, is now the largest contributor at around 37% rather than the whole story. Distribution looks like it grew, but that is because routes are now modelled individually rather than averaged into one 75-mile journey.
07 · Quality and quantity
The number the old
model did not contain
That is the propagated uncertainty on the result. It is calculated by root-sum-of-squares on geometric standard deviations, using the Pedigree Matrix to score every input for reliability, completeness, and temporal, geographic and technological representativeness.
The old assessment reported 0.2114 kg CO2e. Four decimal places, no range, no confidence interval, no sensitivity analysis. That is not a criticism of the people who wrote it so much as a description of what LCA reporting looked like before uncertainty propagation became standard practice. But it is the difference between a number and a measurement.
The rebuilt report also names its own weakest point. It flags the glass bottle as secondary data at medium quality, 50% confidence, marks it as the single most sensitive parameter in the model, and recommends engaging the supplier for primary verified data. A ±20% swing in that one factor moves the whole product result by ±8%.
An assessment that tells you where it is least certain is more useful than one that does not, even though it reads as less confident.
08 · The part that was completely real
They changed the bottle
In 2025 UNROOTED moved glass production from France to the UK, replaced the 500ml dosing bottle with a smaller, lighter 420ml one, and took recycled content from 0% to more than 30%. The shot bottle came down from 66 grams to 60, and now travels 223 km by road from Rotherham rather than crossing the Channel. Shorter freight, less glass, better material. The new bottles hit shelves in September 2025.
Measured against the corrected baseline, that project cut 29% off the carbon footprint of every bottle and saved 26 tonnes CO2e. British Glass gave them a Glass Champion Award for it.
09 · Why this is about to matter to everyone
Completeness checks confirm
that nothing is missing.
They do not ask whether
what is there is right.
The old assessment stated that it captured 99% of emissions and that its completeness check found nothing affecting accuracy by more than 1%. Both statements were true as written. Neither would have caught a glass factor that was carrying half the product’s footprint.
From 2027, under the rebuilt B Corp standards, that distinction stops being academic. Self-reported footprints give way to independently verified ones. A verifier looking at a 2021-era model will go straight to the largest line item and ask where the number came from. “A photography feature about glass recycling” is not an answer anyone wants to give.
10 · Signals your LCA needs rebuilding
Look at yours if
It was built before 2022
01One SKU was measured and extrapolated across your range
02End-of-life recycling credits are absent, or recycling appears only as a cost
03There is no consumer use phase
04Packaging is modelled on generic literature values rather than a named dataset
05Any single line item is more than half your total footprint and has never been checked against a physical benchmark
06You cannot trace an assumption back to the source it came from in under a minute
07The last one is the tell. If the provenance is not recorded, the number cannot be verified, and in eighteen months that will be the only kind of number that counts.
11 · What UNROOTED are doing next
The corrected baseline is
the start of the work
UNROOTED are now scaling a biochar project in Zimbabwe with Carbon Connect and Carbon Future, converting baobab shells that would otherwise be discarded into a carbon sink. Their first purchase of biochar carbon removal credits in January 2026 matched the exact volume of shell by-product created by the baobab they bought in 2025.
We will also be assisting them in preparing for B Corp recertification in 2027, working through every tier of their supply chain using our dedicated B Corp tool that works as a step by step guide through the entire process.
“Sustainability is such a broad space, and it’s genuinely difficult to cover every area well. Having a system that lays out what to prioritise is exactly what we needed.”
“Environmental legislation is changing at a rapid pace, and that shift is going to influence every company, not just at the enterprise level, but for SMEs like UNROOTED. It’s critical that we stay ahead of the game. alkatera makes that simple. The methodology is visually reliable: you can see where the data is sourced, where you need to improve, and what the next step should be.”
Amber Numamoto · Head of Operations and Sustainability · UNROOTED Drinks
Get in touch
Carrying a baseline you are no longer sure about?
alkatera builds life cycle assessments for drinks brands. Every SKU, cradle-to-grave, ISO 14044 and 14067 conformant, with every emission factor traceable to its source.